| 01_how_to_find_a_good_idea.docx |
| 01_selecting_a_topic_web_resources.docx |
| 02_research_report_requirements.docx |
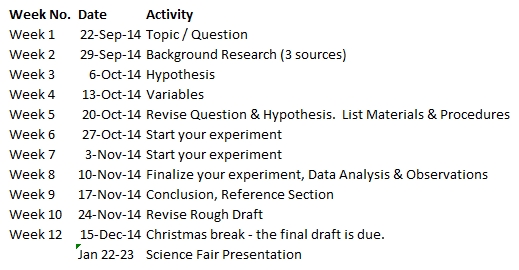
SCIENCE FAIR SCHEDULE
Science Fair resources
- Preparing You and Your Child for Science Fair Success from Science Buddies: This is a perfect resource for parents, and provides some great references for guiding your student through the scientific process. A comprehensive project guide is included, as well a list of project ideas in astronomy, music, cooking and food science, and many different subject areas. There’s also a link to Science Buddies’ “Ask an Expert” forum, a great place to turn for answers.
- Science Fair Central from Discovery Education: There is something here for everyone -- students, parents and teacher. Science fair coordinators will find the guide to a stress-free science fair extremely useful, and the site features a huge list of resources for parents. For students, there’s a little bit of everything, from guides to getting started and lists of ideas, to guides for displaying projects.
- Over 400 of the Best Science Fair Projects: Produced by the Terimore Institute, this list of project ideas is a wonderful place for brainstorming. Featuring “project blueprints” for students of every grade level, this list will pique students’ interests. Perfect for curious minds. There’s also resources for parents and teachers, as well as a long list of reference materials for students.
- Science Fair Resource Guide from the Internet Public Library: There’s a bit of everything here, which makes this guide from the Internet Public Library a great resources for students and parents. Working through the guide’s steps, students will discover every point of a successful science project, from choosing the right idea to hints and tips for using scientific method.
- Video Series: How to Do a Science Fair Project: These videos from the California Institute of Technology are a great resource for students, featuring a short how-to video for every step of the scientific process. Students will gain insights into how the Institute’s scientists conduct experiments. These are great videos; I couldn’t stop watching!
- Education.com's Science Fair Resource Center: A long list of articles from Education.com, touching on every concern, tip and strategy parents can use to support their children through their science project. Tons of great ideas for parents here, including tips to avoid taking over the project, a science project survival guide, and science fairs dos and don’ts. This list features Education.com’s links, as well as links to great outside resources.
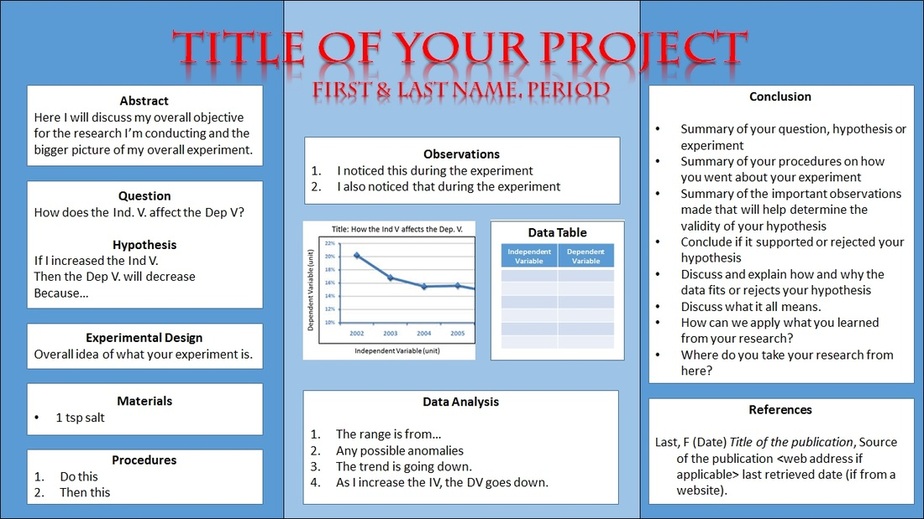
SCIENCE FAIR POSTER EXAMPLE
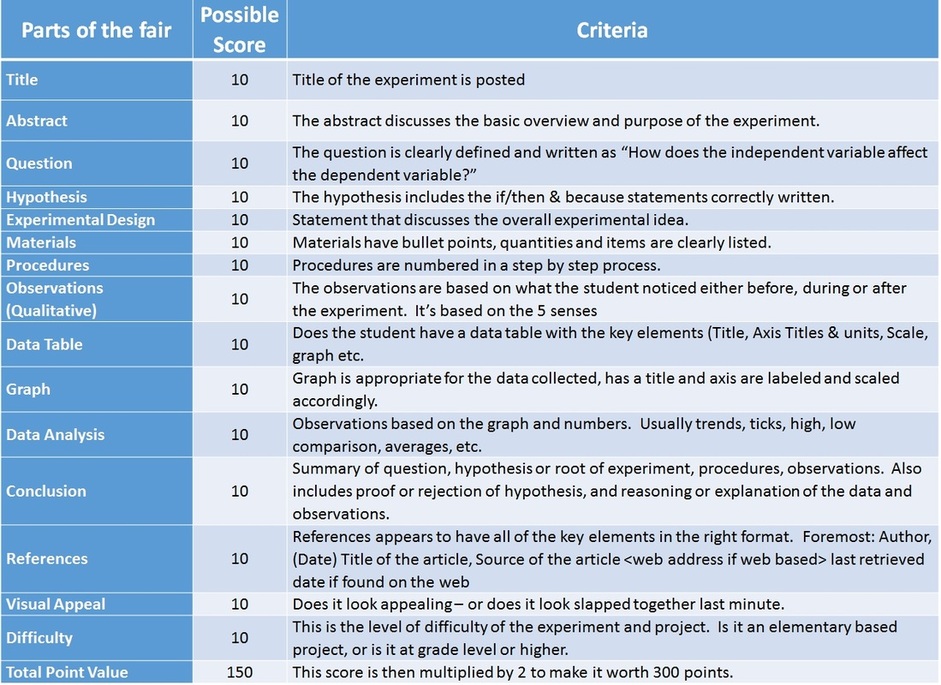
RUBRIC SCORE GUIDE
STARTING YOUR SCIENCE FAIR PROJECT
If you don't have a question to research and wonder what you should do for your science fair project, consider first what are your hobbies or areas of interest. Next consider a more specific area of that area of interest - and what is something you can change about it.
If you're still struggling - consider going to www.sciencebuddies.org - it will help you determine a good science fair project. Just make sure that it is an experiment - and not a report.
If you're still struggling - consider going to www.sciencebuddies.org - it will help you determine a good science fair project. Just make sure that it is an experiment - and not a report.
- It must be core specific. This means that your science fair must be related to the following fields of scientific study: Physics, Chemistry, Geology & Ecology.
- It must be 8th grade level based questions or higher.
- It cannot be similar to a lab we've already done in class.
- There will be no Mento's and Coke experiments.
- There will be no experiments on animals or humans.
- There must be a scientific explanation behind every experiment and cited as such.
Physics Concepts
- Energy
- Simple machines
- Force
- Mass, Weight & Gravity
- Motion
- Rates of Reactions
- Chemical properties
- Chemical Reactions
- Physical Properties of a substance
- Physical Change of a substance
- Conservation of mass
SCIENCE FAIR LAB WRITE UP EXAMPLE WITH KEY ELEMENTS
Abstract
- An Abstract is a basic over view & purpose of your experiment and may contain your basic plans on how you plan on carrying it out.
- An abstract may also include what prompted your question in the first place from some previous experiment or experience. It also may include any background observations/knowledge/research prior to the experiment.
Abstract
In this experiment we will examine the overall properties of water - in particular, cohesion and adhesion. To do this we will investigate how many drops of pure water a penny can hold and compare it to how many drops of water the penny will hold if we inject different materials into the water - such as soap, vinegar, dirt, salt and food dye.
Since cohesion is what allows water to form a dome (Perlman, 2014) - we wanted to see if the different materials affect the cohesion of water. We think that it does and that it will diminish the number of drops of water that a penny can hold due to the dissolved particulates or molecules slipping in between the water molecules - which disrupts the attraction between water molecules.
Experimental Question & Hypothesis:
- Question (More focused & restated)
- Hypothesis (More focused & restated)
- If I change my (independent variable), then my (dependent variable) will change because... (provide the possible explanation for a set of observations here).
Experimental Question and Hypothesis:
Question: How does salt affect the number of drops of water a penny can hold
Hypothesis: If I add 10g of salt to 200 mL of water, then the number of drops a penny can hold will go down because the salt molecules will slip in between the water molecules - which decreases the attraction between each other.
Experimental Design:
- Brief statement explaining the overall experiment
To test this, dissolve 10g of salt into 200mL of water and test to see how many drops of salt water a penny can hold and compare it to the amount of drops of regular water a penny can hold.
Materials
- What materials will you need.
- Be very specific with the quantities included.
Materials:
- 10g Salt
- 2 beakers each containing 200mL of water
- Stirring Rod
- penny
- 2 pipette droppers
Procedures
- Under procedures - list specifically your step by step process you plan on carrying out your experiment.
- Fill up both beakers with 200mL of water
- Measure out 10g of salt
- Place the salt into one of the beakers of water and stir till dissolved.
- You should have one beaker of clean water and another with salt water.
- Place a clean penny on the table.
- Fill the dropper with the salt water solution.
- Place drops of salt water on the penny
- Count the number of drops the penny can hold before it spills over the edge.
- Record the number of drops in the data table.
- Repeat the trial 5 times for the salt water solution and for the clear water.
- After recording 5 trials each, take the average of each solution.
Observations:
- List some things you noticed before, during or after the experiment using your five senses.
- List things that you saw, smelt, felt - or whatever phenomenon you witnessed during or after your experiment.
Observations:
- We noticed that as we conducted our experiment, the clear water had larger drops than the salt water drops - for reasons we’re not sure.
- We also noticed that on our third clean water trials, we had an extremely large number of drops.
- We also noticed that the dropper after the experiment had salt crystals forming outside the pipette/dropper.
Data:
*(Please note that this data is made up and may not reflect true results)
Data Table:
- Organize your numerical data that reflects your experiment
- Trials are usually the furthest on the left, followed by the control, then any independent / changed variable towards the right. For instance, my water is the control - it's the one that I'm comparing everything to. The salt is the independent variable that I'm comparing to the water.
- The average in this case, is what I'm more interested in, thus when I create a graph below, I only use the averages.
Graph:
The elements of the graph include the following:
- Title of the graph - which is your question without the word "does".
- Title on the x axis should be the independent variable + (unit)
- Title on the y axis should be the dependent variable + (unit)
- Scales on the x & y axis should include the range of your data. The scale on your y axis should NOT be your data.
- The graph - whether it be line, bar or pie chart is determined by the type of experiment and data collected. Ask your math or science teacher which is more appropriate if you are unsure.
Data Analysis:
- First, decide what type of graph you will need to best analyze your data (bar or line).
- Look at the trend of your graph
- Look at the range (the highs and lows of both independent and dependent variables) of your data
- Are there any weird data points that don't fit in the trends? If so, that is a possible experimental error.
- If you did trials - what is the average of your data
- Overall - what does your data mean?
Data Analysis:
- Our data shows that the pure water out performed the salt solution by nearly 2:1 on average.
- Our range of data for water ranged from 36-52
- Most of the numbers were in the mid to upper 40’s.
- The 36 drops seems a little out of the ordinary.
- 52 drops may seem to be a little high.
- Our range of data for the salt water solution ranged from 21-25.
- The numbers are closely clustered together.
Conclusion:
This is the biggest, most important part of the experiment. This is where you synthesize the whole project into a short essay - this portion touches on each portion of the write up by addressing the following bullet points:
- Summarize your question
- Summarize your hypothesis
- Summarize your procedures
- Summarize your observations
- Summarize your data analysis
- Discuss your results in relation to the original question
- Discuss if your results prove or disprove your hypothesis
- Give further scientific based explanation to the phenomenon witnessed.
- What steps would I take next.
Conclusion:
In our research, we were investigating how salt affects the cohesive properties of water. To test this, we were using the number of drops a penny can hold as our indicator for cohesiveness after we added salt to the solution.
According to our data, by adding salt to the water seemed to affect the cohesive properties of the water, as indicated by the severe reduction of the number of drops the penny would hold. We were not too surprised with our findings. We did notice some anomalies during our experiment, however. For instance, we did notice that we have a wide range of drops with the pure water solution, which ranged from 36-52. We think the lower number is more of the exception than the rule - as we noticed that the next number in series was closer to the higher number than the lower number. We think it might be because as we dropped the water, the drops may have been slightly bigger, or the drops touched the puddle on the penny, which reduced the number of drops. If we were to run this test again, we need to increase the height the drops that were administered to ensure that the drops don’t come in contact with the puddle while the water is still being formed from the pipet.
The salt water solution, however, has a much tighter range of data - only having a four point difference and each of them in the lower to mid 20’s.
What this means is that our hypothesis is thus far correct - in that the salt does seem to disrupt the cohesive properties of water. We still think that the reason the salt disrupts the cohesive property of water is due largely in part to the salt molecules slipping in between and separating the water molecules. We do know that water is polar and the salt becomes ionic when dissolved in water (Ophardt, 2003). Perhaps the adhesive attraction that water has with the salt is stronger than the cohesive property of water (Freeman, 2007). Further testing would be needed to suggest such a hypothesis; therefore, to further examine to see if cohesion is disrupted with additives dissolved in water, I would suggest that we test to see how sugar and soap affects waters ability to cohesively stick to it's self and to adhesively stick to other materials.
